
From Insight to Impact: A High 5 for your Design
In the first week of #VizReviewLive, the focus was on enhancing visualizations through effective design. We explore key principles like using clear text for clarity, effective layout for understanding, purposeful color for communication, and more. The goal is to elevate analyses from mere data to impactful stories, emphasizing that good design is essential for conveying…

#MakeoverMonday 2024 Week 26 : UEFA EURO 2024 Stats and Facts
Hey All! This week we have a #MakeoverMonday X #SportsvizSunday collab – shoutout CJ Mayes and the team for bringing some sports energy this week. By the way, you should totally check out the Sports Viz Sunday round-up from CJ this week to view more awesome sports + Tableau content. For this week, we get…
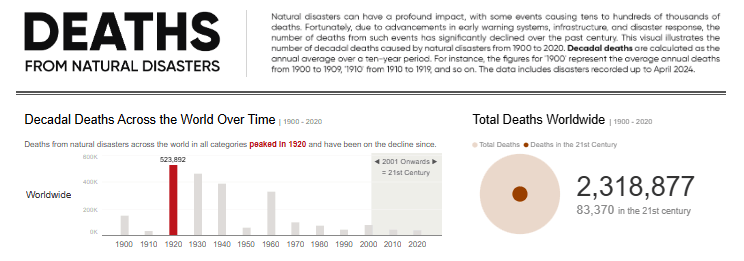
MakeoverMonday 2024 Week 26 : Death from Natural Disasters
For this weeks challenge, we explored the topic of death. Though the focus was more on the causes of death rather than people dying, it’s still a sensitive topic so caution is necessary. Both the dataset and chart comes courtesy of Our World in Data, and looks at the number of deaths caused by natural…
Visualizing DuBois’ Data Portraits – #DuBoisChallenge2023 Recap
Hello Everyone! For a quick reminder, the #DuBoisChallenge has happened every February since 2021. To celebrate Black History Month and honor the legacy of W.E.B. DuBois, data viz practitioners and enthusiasts from around the globe come together to recreate DuBois’ hand-drawn data portraits using modern tools like Tableau, R, and more. Participants are basically given…
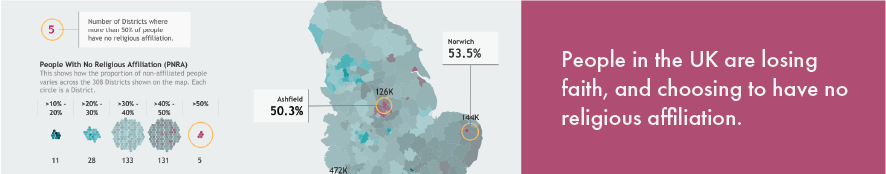
#MakeoverMonday 2022 Week 51 – People with No Religious Affiliation.
In this blog, I do a quick run-through of the thought process behind my most recent #MakeoverMonday viz about people with no religious affiliation in the UK.

Why You Should Participate in Tableau’s Vizzie Awards
Do awards really matter? In this post, we look at what the Tableau Vizzies are, why they matter, and why you should consider participating every time.

Creating Color Palettes Using Adobe Color
This post dives deep into Adobes color tool, highlighting three ways we can leverage it in our Tableau Data Visualization. The 40 palettes I made during the exploration are also available inside for your download and use.
